Data Analysis
TicketGraph
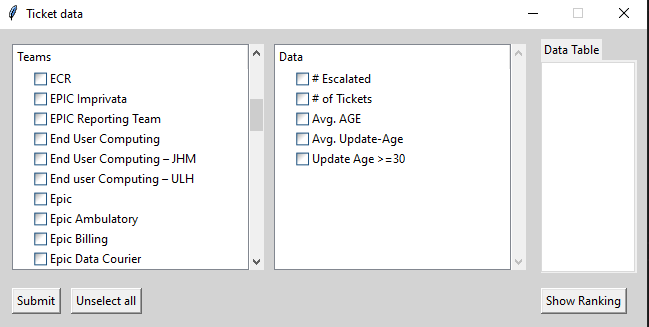
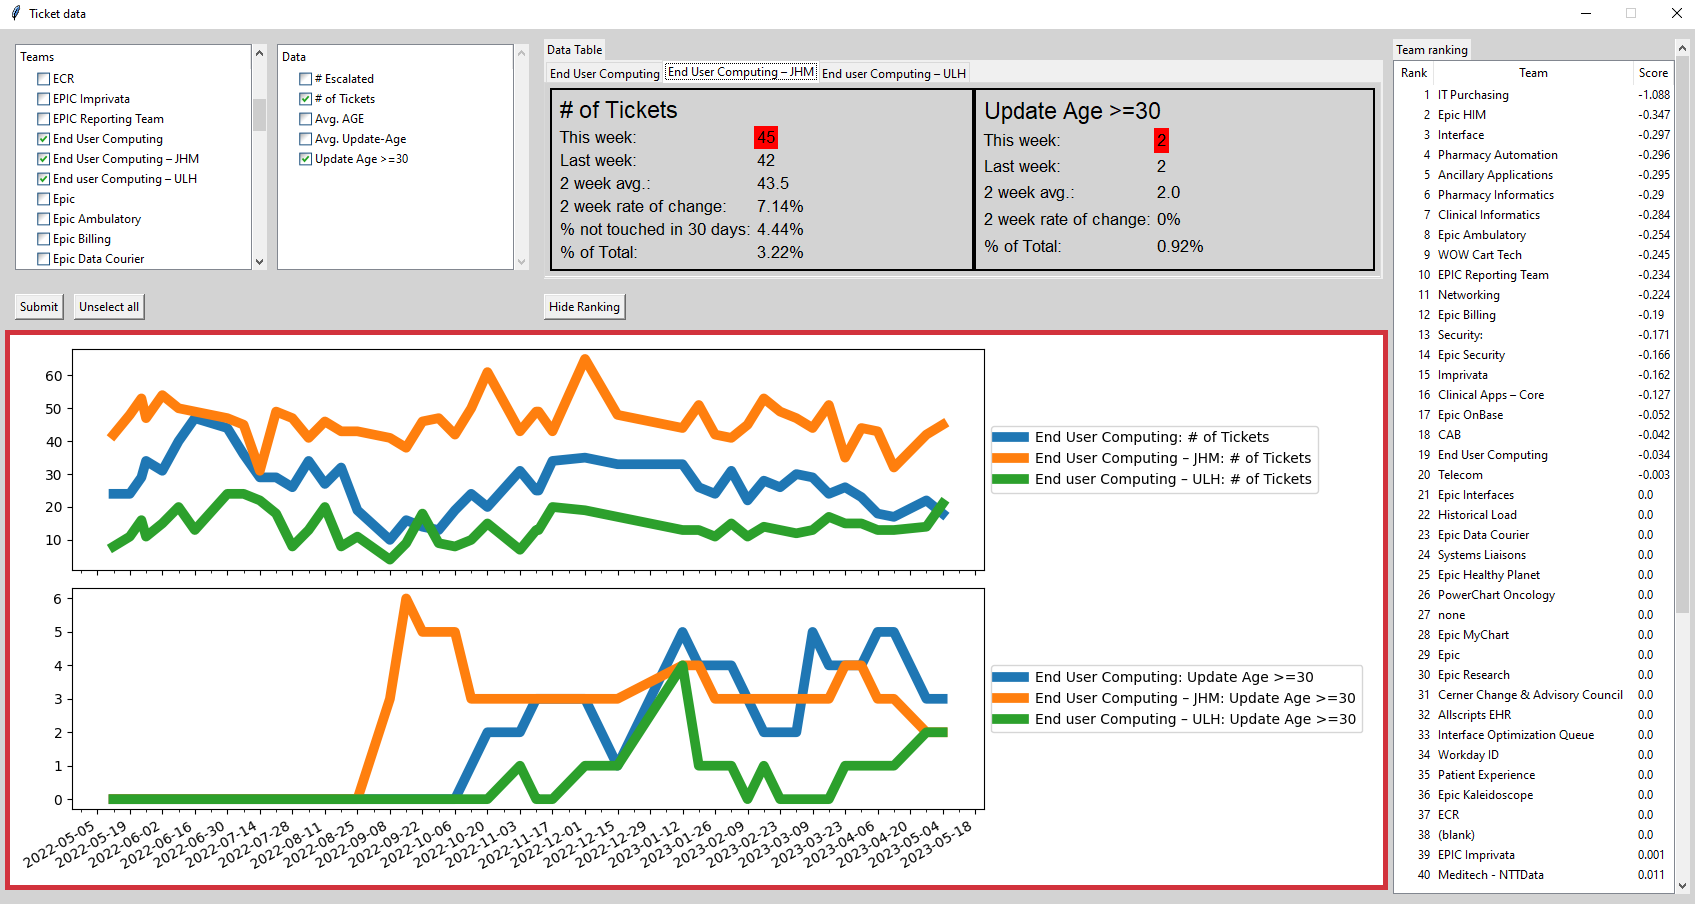
This app was built as the final project of Code Louisville's Data Analytics course, session 1. I created it to be able to view trend data at my workplace for each team. I was put in charge of building a report to show the number of tickets each team has and information about those tickets. The original reports were created using Excel.
AnimeList
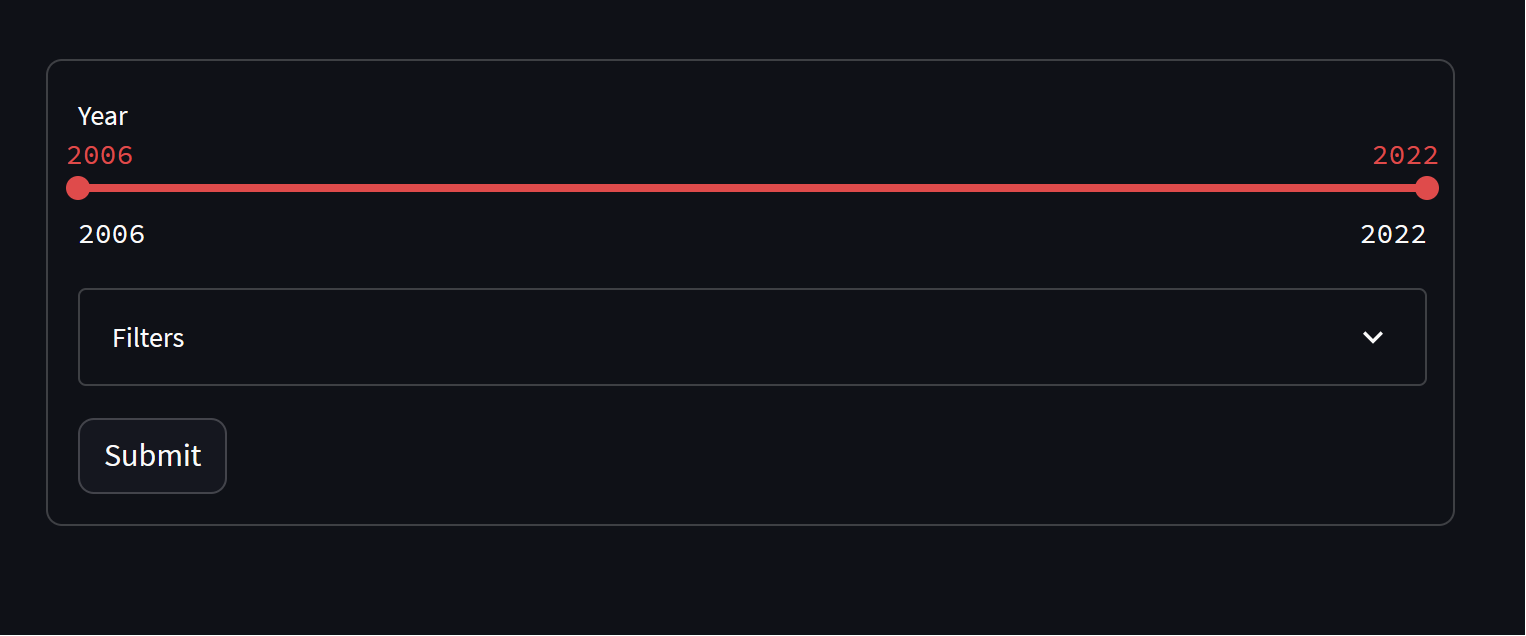
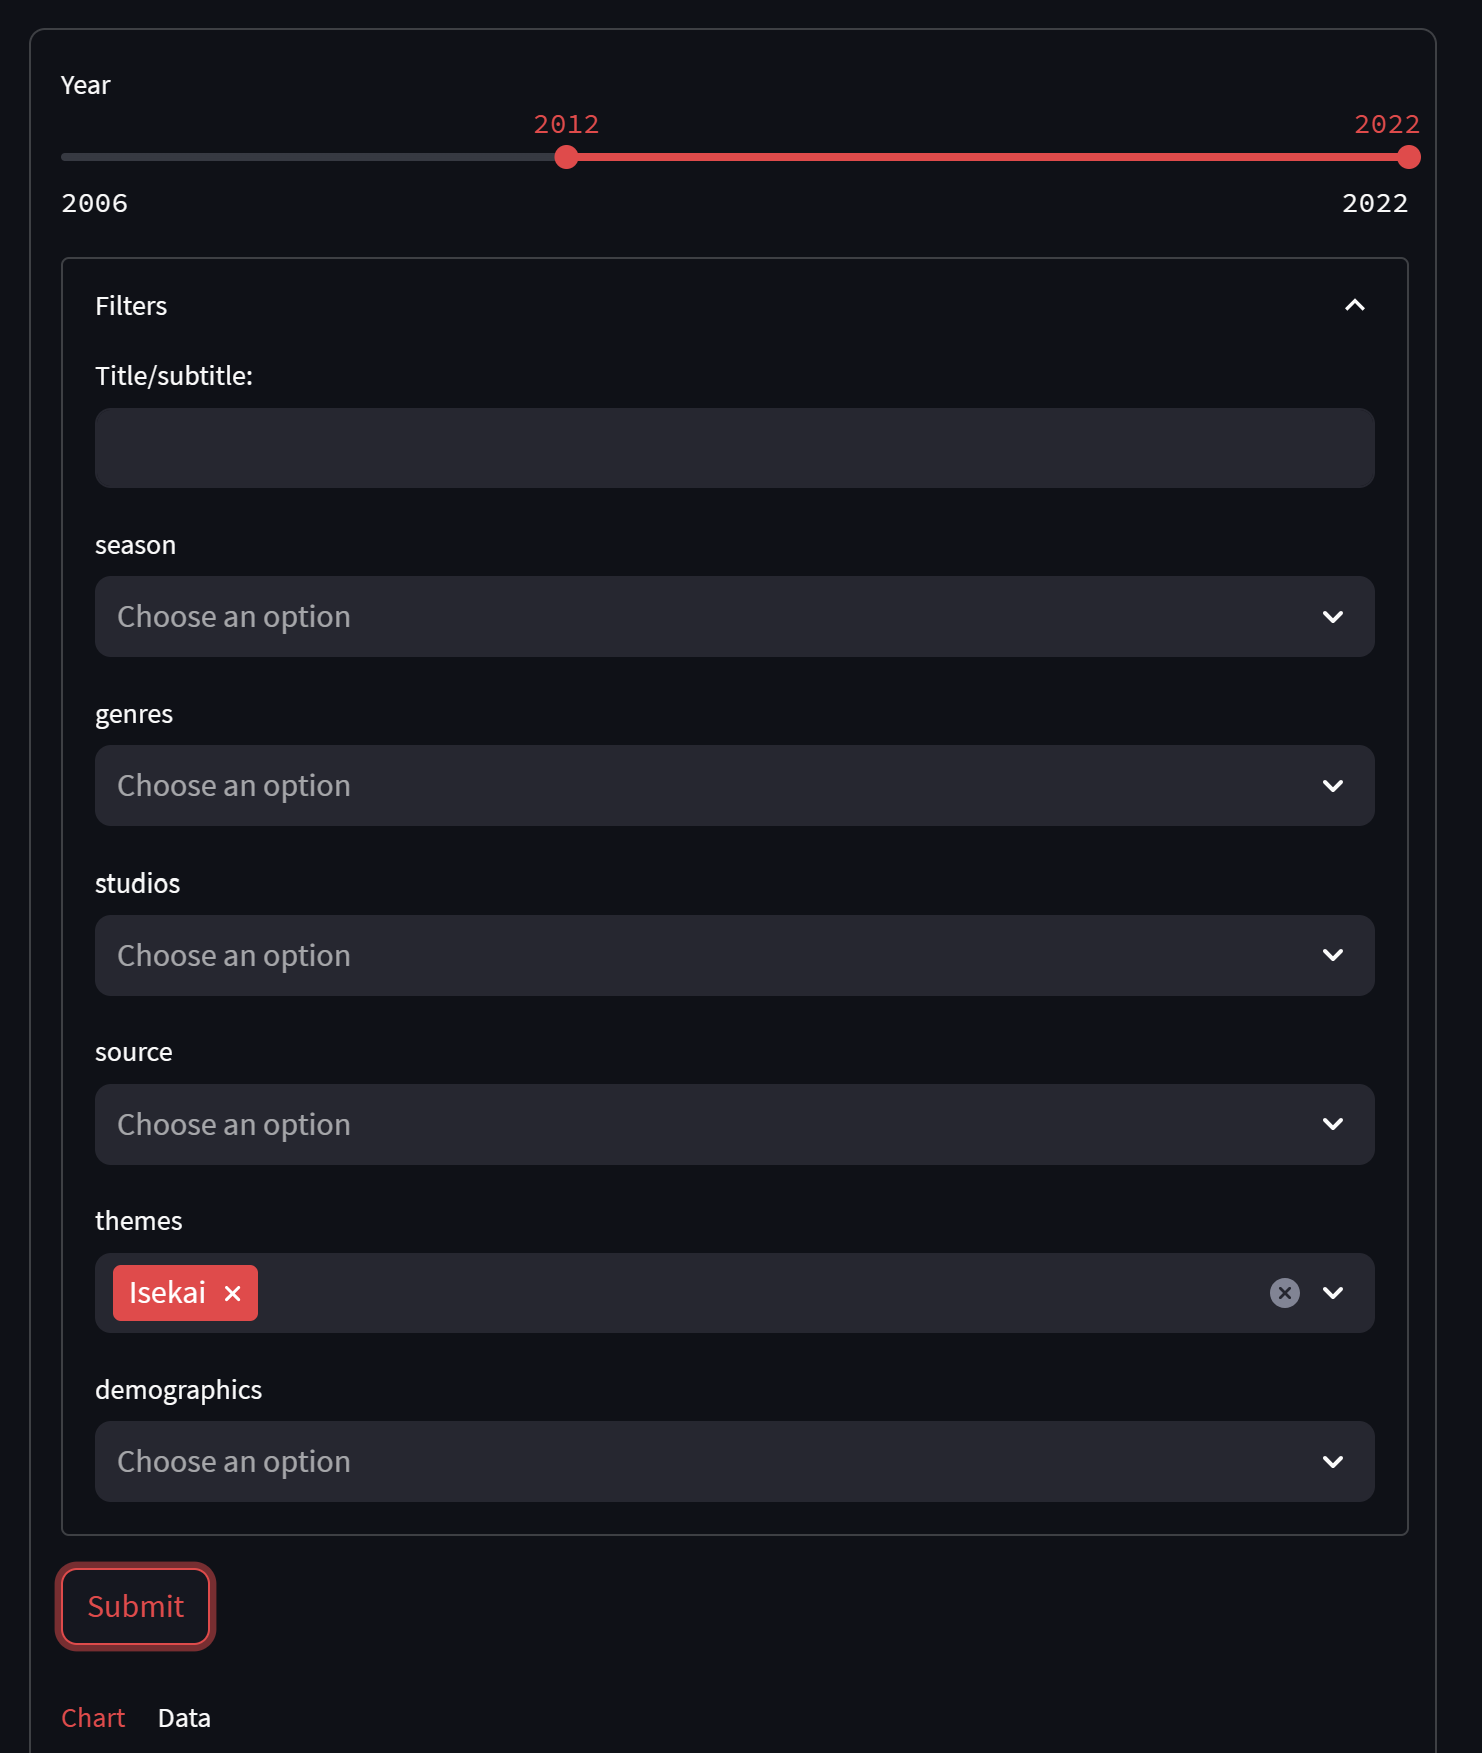
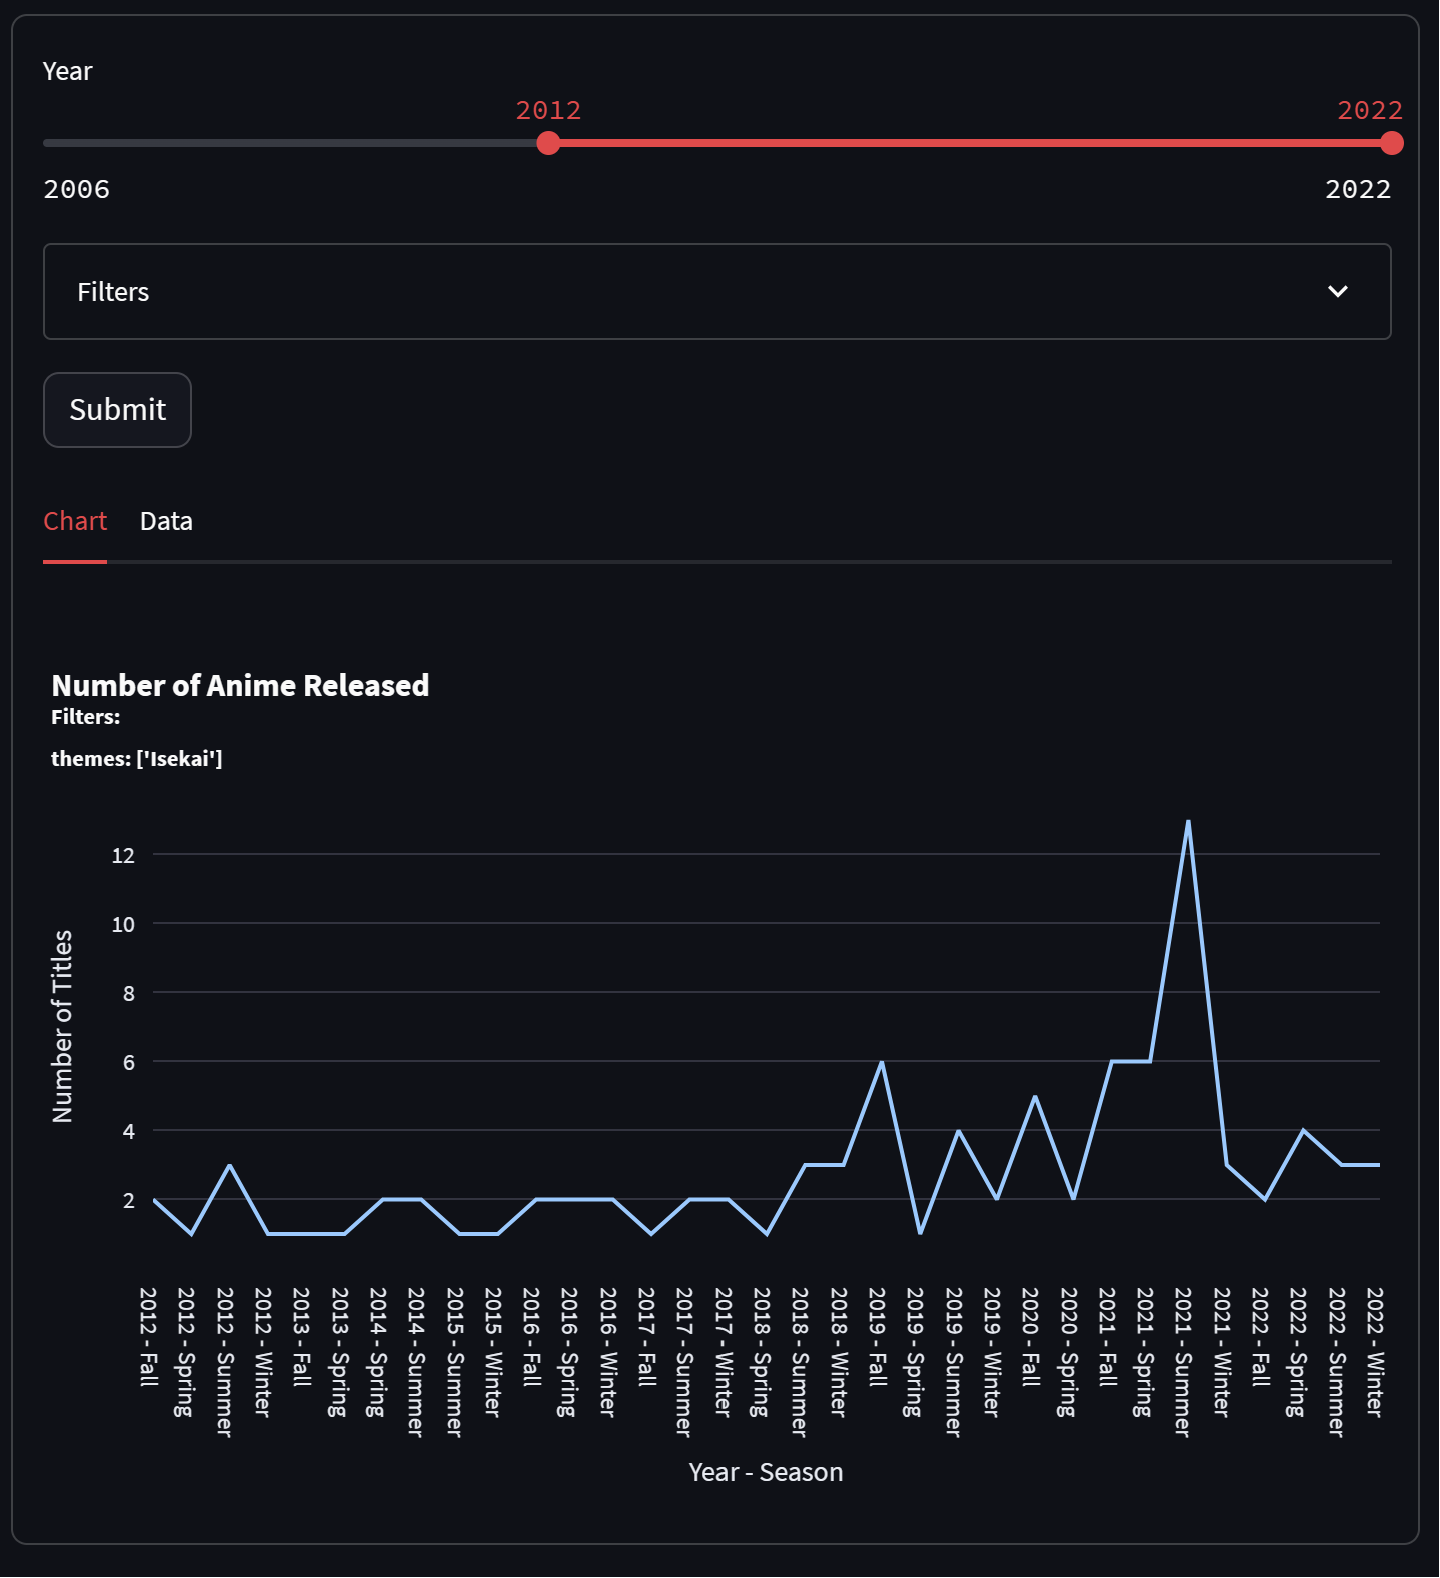
This was the final project of Code Louisville's Data Analytics course, session 2. I set it up to be able to display a table about Anime scraped from AniChart and MyAnimeList, as well as chart a graph to show how many titles were released by year and season.
To view the app, you can visit https://clda2-animelist.streamlit.app/.
